Home > Overview > Financial highlights
Financial highlights
|
2012 |
2011 |
Change |
| Group activities |
R'm |
R'm |
% |
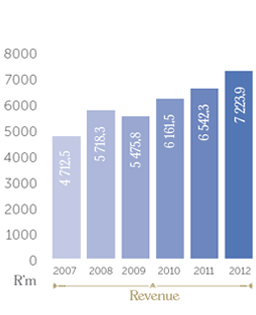
| Revenue |
7 223,9 |
6 542,3 |
10,4 |
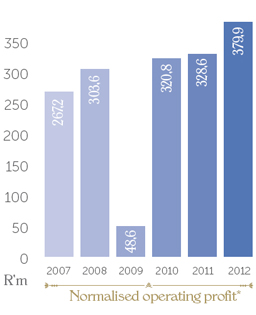
| Normalised operating profit* |
379,9 |
328,6 |
15,6 |
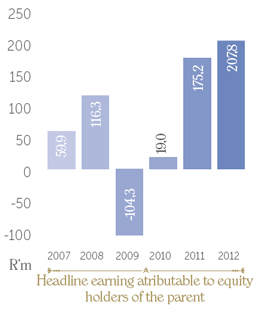
| Headline earnings attributable to equity holders of the parent Company |
207,8 |
175,2 |
18,6 |
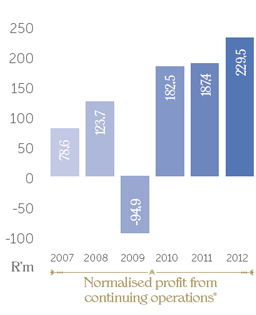
| Normalised profit attributable to equity holders of the parent Company* |
229,5 |
187,4 |
22,5 |
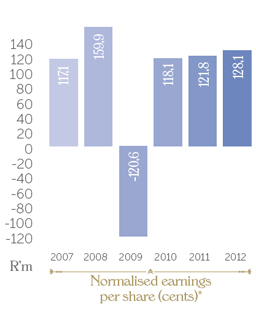
| Normalised earnings per share (cents)* |
128,1 |
121,8 |
5,2; |
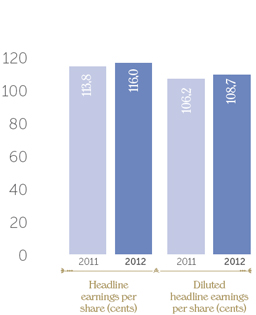
| Headline earnings per share (cents) |
116,0 |
113,8 |
1,9 |
| Diluted headline earnings per share (cents) |
108,7 |
106,2 |
2,4 |
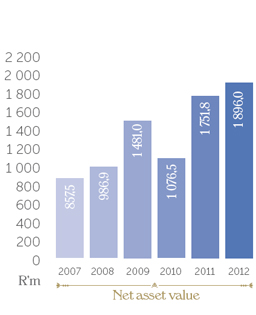
| Net assets |
1 896,0 |
1 751,8 |
8,2 |
| Ratios |
% |
% |
Change |
| Gearing percentage |
(14,2) |
(12,4) |
1,7 |
| Return on shareholders’ funds |
11,3 |
12,9 |
(1,6) |
| Return on net assets |
14,9 |
15,0 |
(0,1) |