Ethical operations – reporting on the 6 capitals
Natural capital
Natural resources are under climate change pressure, which compels food and beverage companies to reduce the carbon emissions and water volumes used in manufacturing their products. This can be achieved by adopting operational best practises and new technologies, although these can be costly. Clover is evaluating how to consolidate our factories and install technologies that will enhance our cost competitiveness, while reducing our carbon generation and water usage. Clover requires high quality water and installs water purification systems to ensure consistent quality water for our operations in areas where water quality can vary.
Clover recognises our responsibility to reduce or even eliminate the impacts of our business on the environment. This responsibility relates not only to Clover's direct operations, but also to our supply chain partners and their environmental impacts.
Clover is therefore implementing an Environmental Management System (EMS) as a structured framework for continually improving our environmental performance.
Clover's Environmental Policy
| Objective | Action | |
|---|---|---|
| Continuously improve environmental performance. | Implement and maintain an effective environmental management system (EMS). Provide a structured framework for continual improvement. Identify and manage progress against set targets per identified aspects. | |
| Educate staff on the EMS and equip them with the necessary skills to implement Clover's environmental policy. | Staff engagement, formal development and training. | |
| Ensure consistent quality of products in line with legal, regulatory and best practise requirements. | Implement quality assurance models in Clover's milk collection and production environments, with product quality being tested by accredited laboratories. Product quality is also monitored through feedback from Clover's Consumer Centre, which handles general enquiries, complaints and compliments. | |
| Reduce carbon footprint. | Quantify carbon footprint from operations and key elements of the supply chain. Set annual targets for reducing it. | |
| Reduce water usage across operations. | Monitor water usage and set targets for reducing water consumption. | |
| Limit the generation of solid and liquid waste and the impact of their disposal on the environment. | Set targets for reducing waste to landfill and monitor results. | |
| Minimise product returns and the impact thereof on the environment. | Implement programmes to continuously reduce returns. | |
| Reduce energy consumption and associated emissions. | Monitor energy usage and set targets for reducing consumption. | |
| Manage impacts for on-site storage of fuels and chemicals, both during normal operation and in the event of spills and emergencies. | Implementation and monitoring of procedures. | |
| Optimise the use of primary and secondary packaging. | Monitor wastage and implement improvement processes and targets. | |
| Adhere to all applicable environmental legislation. | Continuously review and revise the ambit and effectiveness of the EMS. | |
| Ensure continuous monitoring of and reduction in the impacts associated with milk supply. | Support and help develop the Best Farming Practices Programme. | |
| Inform supply chain partners on activities to reduce environmental impact and partner with them to reduce their own impact. | Formally engage with partners in the supply chain. | |
| Ensure Health and Safety throughout all operations. | Continuous monitoring to ensure safe working environments. |
Environmental
Clover's environmental strategy commenced formally in the 2011 financial year, when we accepted our responsibility to reduce, and as far as possible, to eliminate the environmental impact of our business. Environmental excellence offers business efficiencies, as energy and services costs usually comprise approximately 19% of a food manufacturer's fixed costs.
We have extended this duty of environmental care to our supply chain partners, so that they begin controlling their environmental impacts if they don't already do so. Clover actively monitors environmental, health, safety and quality through the use of our dedicated Entropy SHEQ management system and other forms of assurance, such as internal and external audits.
Our Social and Ethics Committee requires each business unit to regularly report its impact on the environment, based on agreed measures. The Chief Engineer of Maintenance and Safety, Health and Environment reports on Clover's environmental strategies and compliance with SHE measures.
Clover has evaluated section 12L incentives for business cases where savings in the supply chain can be achieved. This incentive applies to not only electricity savings but includes diesel savings. This may result in compact milk transporters being replaced with larger tankers.
Section 12L of the Income Tax Act – Deduction in respect of energy efficiency savings – came into effect on the 1 November 2013. This tax incentive allows taxpayers to claim deductions of 95 cents per kilowatt hour (equals R10 per litre diesel saved), or kilowatt hour equivalent, of energy efficiency savings made against a baseline measured at the start of each year of assessment. This opportunity to claim tax deductions applies to all measured and verified savings achieved before 2020.
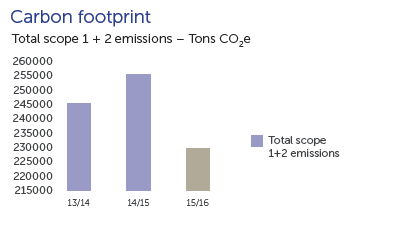
Clover has on average reduced its carbon emissions by 8,5% for the year to June 2016, which should enable Clover to qualify for section 12L claims for the June 2016 financial year end.
Operational Efficiency
| 2013/2014 | 2014/2015 | 2015/2016 | |
| Total Direct Energy Consumption (Gigajoules, GJ) – i.e. from fuels burned | 1 445 980 | 1 514 773 | 1 353 188 |
|---|---|---|---|
| Total Indirect Energy Consumption (Gigajoules, GJ) – i.e. from electricity consumed | 474 801 | 482 168 | 447 262 |
| Total Electricity Consumption (MWh) | 131 889 | 133 936 | 124 236 |
| Total Energy Consumption in Gigajoules | 3 | 1 966 941 | 1 800 449 |
| Electricity consumed per kg product produced (kWh/ton) | 142,4 | 137,3 | 120,01 |
| Fuel consumed for steam generation (coal, diesel, HFO, per product produced (kWh eq/ton) | 423 | 402 | 379 |
| Waste to landfill in kg per ton produced | 9,3 | 7,3 | 8,3 |
| Total weight of non-hazardous waste disposed (ton) | 4 | 5 940 | 36 175 |
| Total weight of hazardous waste disposed (ton) | 4 | 758 | 2 538 |
| Total weight of waste sent for recycling (ton) | 4 | 8 552 | 9 065 |
| Percentage of waste disposed of that is sent for recycling5 | 58 | 71 | 68 |
| Water consumed (Litres) per kg of product produced1 | 4,09 | 3,79 | 3,84 |
| Total Water Consumption (Kilolitres, or Kl)5,6 | 2 503 146 | 2 604 358 | 2 713 623 |
| Average Volume of Water (Litres) Consumed per Person Hour Worked (l/HW)6 | 3 | 139,06 | 144,43 |
| Carbon Footprint2 | |||
| Total Carbon Emissions (Tons of carbon dioxide equivalents, CO2e) | 245 357 | 255 482 | 229 887 |
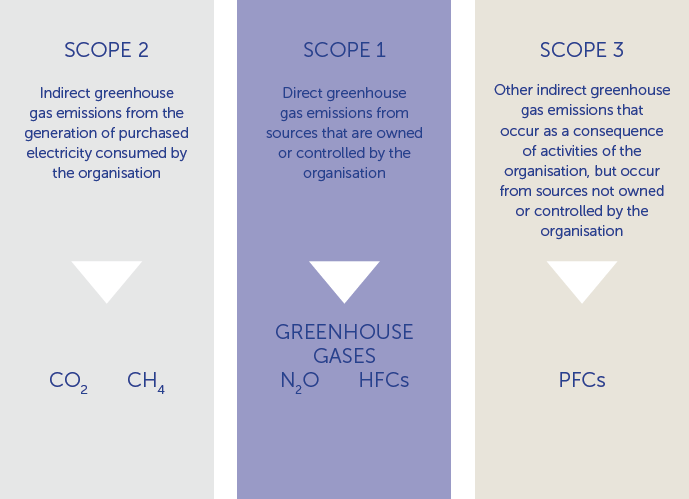
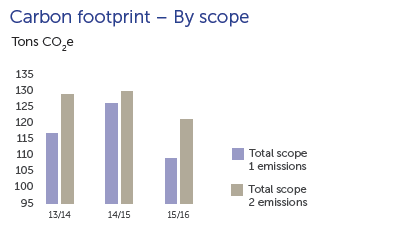
| Total Scope 1 Emissions (Tons CO2 eq) | 116 659 | 125 887 | 108 868 |
| Total Scope 2 Emissions (Tons CO2 eq) | 128 698 | 129 595 | 121 018 |
| Average Volume of Carbon Emissions per Person Hour Worked (Tons CO2e/HW)6 | 3 | 0,0136 | 0,0109 |
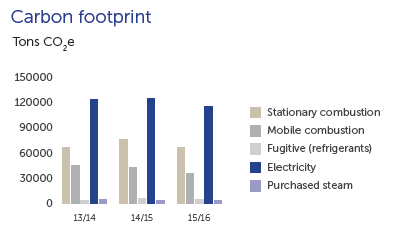
| Trends per Source | |||
| Stationery combustion (Tons CO2 eq) | 67 304 | 76 495 | 67 511 |
| Mobile combustion (Tons CO2 eq) | 45 595 | 43 027 | 36 678 |
| Fugitive (refrigerants) (Tons CO2 eq) | 3 759 | 6 365 | 5 139 |
| Electricity (Tons CO2 eq) | 123 955 | 125 878 | 116 182 |
| Purchased steam (Tons CO2 eq) | 4 744 | 3 717 | 4 257 |
1 Please note that water consumption is only reported for production, however production constitutes 95% of all Clover's water usage.
2 Data in respect of carbon footprint include all entities acquired during the year.
3 Data for this period is unavailable. Data for the 2014/2015 period will be used as a base for future reporting periods.
4 Please note: the figures for 2014/15 and 2015/16 years, includes the entire supply chain. Figures for 2013/14 were not available at the time.
5 Please note this relates to production only.
6 Please note figures for previous years have been restated.
Carbon footprint
Clover's carbon footprint extends over the operations of the following five business units:
| Business unit | Description/key activity |
|---|---|
| Head Office | Corporate administration, marketing, management. |
| Procurement | Transportation of raw milk and materials from suppliers to Clover facilities. |
| Production | Facilities for the processing, packaging and dispatching of products. |
| Primary Distribution | Transport of products from production facilities to primary and secondary distribution centres. |
| Secondary Distribution | Clover controls a large number of secondary distribution facilities across South Africa that handles own and principal clients' products. Distribution is to retail customers through leased vehicles, under the control of Clover. |
Value creation
IN THE PAST
In earlier years Clover was a cooperative driven by producer supply imperatives. We were firm on legislative compliance, emphasised accurate invoicing from service providers and closely monitored any potential under or over billing for critical inputs such as utilities. We focused primarily on water quality, fuel, electricity and other costs, but our primary focus was meeting our producers' value creation objectives. These aspects remain important to Clover's value creation, but given the change to a demand driven company, our new objectives need to be evaluated alongside shareholder value, a myriad of changes in legislation, and best practice compliance.
PRESENT
The significant ramp up of relative pricing for energy and other utilities has a major impact on Clover. Relative pricing has risen to such an extent that we need to sharply reduce our consumption of resources to remain competitive. This is especially true in the case of water, sanitation and electricity. Price increases are a powerful incentive to utilise natural resources more efficiently. We have set Clover's performance targets for usage of these resources, supported by regular appraisals. Clover's constant focus on electricity, fuel and water consumption and carbon emissions further delivered efficiency improvements and utility cost reductions in this year of review.
FUTURE
South Africa faces significant water, sanitation and electricity constraints at present, which require heavy investment in natural infrastructure from government and the private sector to rectify. Tariffs will inevitably increase and we anticipate that increases will exceed the average rate of inflation for an extended period of time. Clover has therefore embarked on a journey of continuous efficiency improvements to reduce resource consumption. These efficiency improvements will be self-financing through reduced usage and will contribute to Clover's financial sustainability in the medium to long term.
Clover intends partnering with specialist service providers to ensure economies of scale through new technologies that will make Clover the efficiency leader in our market segments. Projected efficiencies include eliminating waste to landfill and effluent initiatives, among other environmental impacts.
Clover makes use of available grants and tax allowances to implement “Green technologies''.
Clover's end goal is to create long term and sustainable value through good corporate citizenship.