How clover creates value and reporting on the six capitals
- How Clover creates value today
- Overview of Clover’s value creation process
- Reporting on the six capitals
- Clover’s business model
- Human capital
- Natural capital
- Manufactured capital
- Intellectual capital
- Social and relationship capital
- Financial capital
- How Clover sustains value for Tomorrow
- Clover’s future value creation philosophy
- Human capital
- Natural capital
- Manufactured capital
- Intellectual capital
- Social and relationship capital
- Combined Assurance
Natural Capital
How Clover creates value today: Natural Capital
 The significant ramp-up of relative pricing of energy and other utilities had a major impact on Clover during the review period. Strategies are under way to sharply reduce our consumption of resources to remain competitive, especially with regard to water, sanitation and electricity. Infrastructure constraints at municipal level, has resulted in a deterioration in the quality of municipal water and electricity provision. This places additional pressure on Clover to ensure sufficient chilled storage space, and contingencies to minimize impact on production. Clover’s constant focus on electricity, fuel and water consumption and carbon emissions further delivered efficiency improvements and utility cost reductions in the year under review and were in line with performance targets.
Clover recognises our responsibility to reduce or even eliminate the impacts of our business on the environment. This responsibility relates not only to Clover’s direct operations, but also to our supply chain partners and their environmental impacts.
Clover is therefore implementing an Environmental Management System (EMS) as a structured framework for continually improving our environmental performance.
Carbon footprint
Clover’s carbon footprint extends over the operations of the following four business units:
| Business unit | Description/key activity |
| Head office | Corporate administration, marketing, management. |
| Procurement | Transportation of raw milk and materials from suppliers to Clover facilities. |
| Production | Facilities for the processing, packaging and dispatching of products. |
| Primary distribution | Transport of products from production facilities to primary and secondary distribution centres. |
Environmental
Clover’s environmental strategy commenced formally in the 2011 financial year, when we accepted our responsibility to reduce, and as far as possible, to eliminate the environmental impact of our business. Environmental excellence offers business efficiencies, as energy and services costs usually comprise approximately 19% of a food manufacturer’s fixed costs.
We have extended this duty of environmental care to our supply chain partners. Clover actively monitors environmental, health, safety and quality through the use of our dedicated Entropy SHEQ management system and other forms of assurance, such as internal and external audits.
The Clover production division has been certified as compliant with the ISO 14001 standard.
Operational Efficiency
| 2014/15 | 2015/2016 | 2016/17 | |
| Total Direct Energy Consumption (Gigajoules, GJ) – i.e. from fuels burned | 1 514 773 | 1 353 188 | 1 411 596 |
| Total Indirect Energy Consumption (Gigajoules, GJ) – i.e. from electricity consumed | 482 168 | 447 262 | 445 027 |
| Total Electricity Consumption (MWh) | 133 936 | 124 236 | 124 152 |
| Total Energy Consumption in Gigajoules | 1 966 941 | 1 800 449 | 1 856 623 |
| Electricity consumed per kg product produced (kWh/ton) | 137,3 | 120,01 | 112,4 |
| Fuel consumed for steam generation (coal, diesel, HFO, per product produced | 402 | 379 | 359 |
| (kWh eq/ton) | |||
| Waste to landfill in kg per ton produced | 7,3 | 8,3 | 6,2 |
| Total weight of non-hazardous waste disposed (ton) | 4 767 | 6 529 | 4 367 |
| Total weight of hazardous waste disposed (ton) | 38,3 | 16,8 | 3,8 |
| Total weight of waste sent for recycling (ton) | 1 695 | 1 651 | 3 491 |
| Percentage of waste disposed of that is sent for recycling | 66 | 55 | 70 |
| Water consumed (litres) per kg of product produced | 4,03 | 3,85 | 3,9 |
| Total Water Consumption (kilolitres, or Kl) | 2 604 358 | 2 713 623 | 2 711 524 |
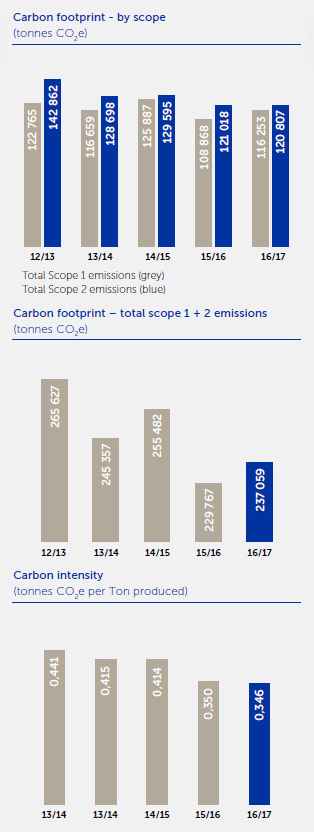
| Carbon footprint | |||
| Total Carbon Emissions (tons of carbon dioxide equivalents, CO2e) | 255 482 | 229 887 | 237 059 |
| Total Scope 1 Emissions (tons CO2 eq) | 125 887 | 108 868 | 116 253 |
| Total Scope 2 Emissions (tons CO2 eq) | 129 595 | 121 018 | 120 807 |
Key Natural Capital inputs
- Product ingredients, packaging materials, fuel and electricity.
- Clover’s production facilities and large distribution network.
- Performance targets have been set for usage of resources (e.g. Water, fuel, electricity).
- Clover’s Environmental strategy.
Outputs
| 2017 | 2016 | |
| Total direct energy consumption (GJ) | 1 411 596 | 1 353 188 |
| Total electricity consumption (MWh) | 124 152 | 124 236 |
| Electriciy consumed per KG of product produced (kWh/ton) | 112,4 | 120,0 |
| Water consumed per kg of product produced (L) | 3,9 | 3,9 |
| Total carbon emissions | 237 059 | 229 887 |
Outcomes
- More efficient processes to reduce costs and quantities of inputs.
- Less impact on environment and reduced production costs per unit.
- Reduced emissions and non-recyclable waste.