CHIEF FINANCIAL OFFICER’S REPORT

Clover’s board and management believe the financial statements published in this integrated report present fairly, in all material respects, the financial position, financial performance and cash flows of Clover Industries Limited in accordance with International Financial Reporting Standards (IFRS) and without any material misstatements.
Significant accounting policies adopted in preparation of the financial statements are appropriately described in the financial statements section of this integrated report. The board and senior management are confident that Clover’s internal control system is adequate for preparing accurate financial statements in accordance with IFRS and the requirements of the Companies Act.
OVERVIEW AND ENVIRONMENT
Rising fuel and transport prices, electricity, medical insurance and other increases continued to place pressure on South African consumers, which was further negatively impacted by a 1% increase in value added tax in the latter part of the financial year under review.
The erosion of available discretionary spend reflected in buying patterns as consumers increasingly elected to buy on price promotions. This trend tested the inelasticity of historically premium-branded products and resulted in fierce competition amongst FMCG companies in an attempt to maintain and grow volumes and market share.
From this perspective, Clover’s strategy to re-invest savings obtained through efficiencies to maintain optimal price points, served as a critical underpin to its performance during the year.
GROUP OVERVIEW
As detailed elsewhere in this report, the board took the conservative and prudent decision to impair the full R439 million revolving credit facility Clover had extended to DFSA as at year-end.
In line with the objective to improve the predictive value of the financial statements, the impairment of the DFSA RCF was reversed in the pro forma results to better reflect the operational performance of the Group. Refer to Annexure I and II for further infomation.
Despite the impact of the impairment, Clover’s hard-fought efforts made a number of significant improvements across key performance areas.
The prior financial year was impacted by severe drought, currency volatility and above-inflation input costs. Price increases in a subdued market, amidst aggressive competitor pricing, resulted in Clover reporting volume and market share losses.
During that year, Clover initiated its strategy to sustainably align the business to a new “normal” in the context of protracted low-growth cycle in the domestic economy.
These rigorous initiatives identified several efficiency improvement opportunities, allowing management to offset inevitable production increases against savings to the benefit of consumers.
Clover’s continued delivery against its diversification strategy away from bulk, commoditised food stuffs and focus on growing its presence in branded, value-added product categories continued to gain traction during the review period and – along with sustainable efficiency improvements remain a key priority for management in the 2019 financial year and into the future.
FINANCIAL RESULTS
As indicated in the 2017 financial statements, Clover transferred the non-value added dairy business to its wholly-owned subsidiary, DFSA with effect from 1 April 2017. Subsequently, shares were issued to the milk producers with the result that Clover lost control of DFSA. Clover has a 26% voting right and no economic interest in DFSA.
The result of the transaction is that Clover maintained ownership and control of the relevant manufacturing and distribution (warehousing and logistics) activities and charges a fee for these services. The sales of the relevant products are for the benefit of DFSA, and no longer form part of the revenue or cost of sales of the CIL group.
The revenue and cost of sales of the DFSA business were significant to Clover in the 2017 the financial year, as is the revenue earned from the rendering of the manufacturing and distribution services in the 2018 financial year. Given the significance of the revenue, costs of sales and the income from manufacturing and distribution services in the respective years, it is important to reflect the impact of the transaction to understand the key revenue streams retained (and related cost of sales); and the change in the services revenues now earned as a result of the transaction. The changes are reflected in Annexure I and II at the back of this report.
Headline loss
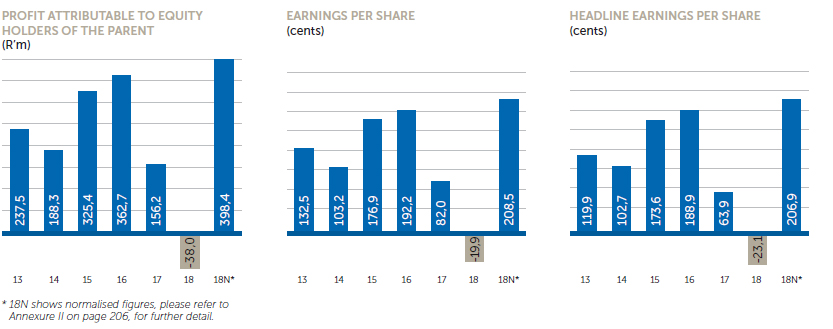
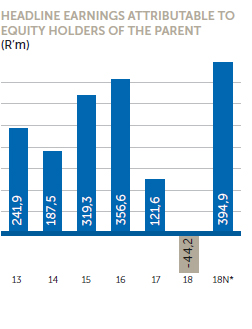
Clover incurred a headline loss of R44,2 million compared to a headline earnings of R121,6 million in the comparative period as reflected in note 7.4 in the financial statement section. The headline loss is primarily as a result of the impairment of the DFSA revolving credit facility as alluded to in the Group Overview.
Loss attributable to shareholders of Clover amounting to R38,0 million represents a decrease of R196,3 million from the profit attributable to shareholders of Clover in 2017 of R158,3 million. This is R30,5 million less than the decrease in headline loss of R165,8 million. This difference is mainly due to profits of a capital nature in the prior year (which is excluded from headline earnings). Capital profits to the same extent were not realised in the current year.
Headline loss per share for the year amounted to 23,1 cents per share compared to a headline earnings per share of 63,9 cents per share in the comparative period.
Normalised headline earnings
Normalised headline earnings (arrived at by adding back the impairment of the RCF) increased by 224,7% or R273,2 million to R394,9 million when compared to the 2017 reported results. The increase in normalised headline earnings is primarily because of headline operating profit, which increased by 122,3% or R332,5 million; net finance costs, which decreased by 29,2% or R38,9 million; headline tax expense, which increased by 296,2% or R103,9 million; share of profit from a joint venture, which increased by 14,2% or R2,6 million; and non-controlling interests, which decreased from a R0,5 million profit to a R2,6 million expense. Normalised headline earnings per share increased by 224,0% (143,0 cents). The normalised effective tax rate base increased by 5,4% to 25,9% that is explained in more detail under “Profit for the year” later in this report;
Normalised profit attributable to shareholders of Clover increased by R242,8 million which is R30,4 million less than the increase in normalised headline earnings of R273,3 million for reasons similar to those as discussed under Headline loss.
Revenue, cost of sales and gross profit
With the unbundling of DFSA from the operations of Clover (effective from 1 July 2017) as discussed in detail in the 2017 integrated report, the comparative financial information for revenue (comprising mainly of sale of product and rendering of services), cost of sales and gross profit are not comparable with those line items reported in the June 2017 reporting period. It will therefore be of more value to compare pro forma information taking the effect of the operational restructuring of DFSA into account when commenting on the current year’s performance compared to the previous year. The pro forma adjustments on 30 June 2017 had no effect on the profit for that year as illustrated below.
The table below is an extract of the audited and pro forma comparable information that will be used for the further review (on a like-for-like basis) of the current year financial results
| 30 June 2018 Audited R’000 |
30 June 2018 Pro forma normalised(1) R’000 |
30 June 2017 Pro forma Adjusted(2) R’000 |
30 June 2017 Audited R’000 |
|
| Sales of products | 6 435 663 | 6 435 663 | 5 852 036 | 9 401 842 |
|---|---|---|---|---|
| Rendering of services | 1 873 581 | 1 873 581 | 1 834 421 | 641 499 |
| Sale of raw milk | 335 | 335 | 11 907 | 11 907 |
| Rental income | 2 898 | 2 898 | 3 351 | 3 351 |
| Revenue | 8 312 477 | 8 312 477 | 7 701 715 | 10 058 599 |
| Cost of sales | (5 357 424) | (5 357 424) | (5 012 009) | (7 333 041) |
| Gross profit | 2 955 053 | 2 955 053 | 2 689 706 | 2 725 558 |
| Other operating income | 82 913 | 82 913 | 60 040 | 60 040 |
| Selling and distribution costs | (2 117 936) | (2 117 936) | (2 089 364) | (2 089 364) |
| Administrative expenses | (273 310) | (273 310) | (284 721) | (284 721) |
| Restructuring expenses | (4 123) | (4 123) | (48 098) | (48 098) |
| Other operating expenses | (31 548) | (31 548) | (48 936) | (48 936) |
| Operating profit | 611,049 | 611,049 | 278 627 | 314 479 |
| Impairment of RCF to DFSA | (439 042) | – | – | – |
| Finance income | 47 618 | 47 618 | 48 499 | 12 647 |
| Finance costs | (141 880) | (141 880) | (145 765) | (145 765) |
| Share of profit in a joint venture | 21 104 | 21 104 | 18 486 | 18 486 |
| Profit before tax | 98 849 | 537 891 | 199 847 | 199 847 |
| Taxation | (139 509) | (139 509) | (41 105) | (41 105) |
| (Loss)/Profit for the year | (40 660) | 398 382 | 158 742 | 158 742 |
| (1) | As per the pro forma consolidated statement of comprehensive income for the year ended 30 June 2018 as disclosed in Annexure II to the consolidated financial statements for the year ended 30 June 2018. |
| (2) | As per the pro forma consolidated statement of comprehensive income for the year ended 30 June 1017 as disclosed in Annexure I to the consolidated financial statements for the year ended 30 June 2018. Please refer to Annexure I for more details regarding the basis for the pro forma consolidated statement of comprehensive income. |
Revenue
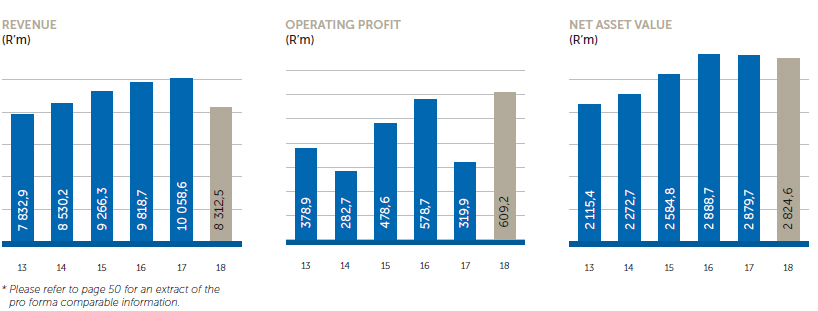
Revenue increased by 7.9% or R610,8 million to R8 312,5 million.
Sale of products showed an increase of 10.0% to R6 435,7 million
| Percentage change | 30 June 2018 Audited R’000 |
After pro forma adjustments 30 June 2017 R’000 | 30 June 2017 Audited R’000 |
|
| Revenue from sale of products | 10,0 | 6 435 663 | 5 852 036 | 9 401 842 |
|---|---|---|---|---|
| – Non-alcoholic beverages | 1,7 | 2 409 724 | 2 369 071 | 2 369 071 |
| – Concentrated products | 13,7 | 1 492 849 | 1 312 575 | 1 312 575 |
| – Value-added dairy fluids | 12,5 | 1 230 831 | 1 093 794 | 4 643 600 |
| – Fermented products and desserts | 25,7 | 998 847 | 794 403 | 794 403 |
| – Ingredients | (18,5) | 176 484 | 216 424 | 216 424 |
| – Olive oil and soya | 93,0 | 126 928 | 65 769 | 65 769 |
The increase of 10,0% in revenue from sale of products, compared on a like-for-like basis, was achieved through increased volumes in certain categories – most notably in fermented products and deserts as well as value-added dairy fluids (up 12,5%) where optimal pricing were rewarded with higher volumes. In the dairy concentrated product category (up 13,7%), the shortage of butterfat during most part of the year led to above-inflationary price increases on butter, but lower volumes, whilst volumes in cheese increased on the back of no price increases.
Revenue from non-alcoholic beverages were up by a moderate 1,7%, largely as a result of flat overall volumes. Revenue was lifted by moderate price increases towards the end of the financial year and the launch of Rooibos ice tea and Cranberry Krush during April 2018.
The addition and launch of new products including olive oil and soya products to the portfolio further supplemented revenue growth.
Services rendered to principals contributed R1 873,6 million to revenue, which increased moderately by 2,1% or R39,3 million on a comparable like-for-like basis. The marginal growth in rendering of services income was primarily because of subdued market conditions impacting our principals, which was further compounded by the outbreak of listerioses, and the subsequent withdrawal of products by one of our principals. Although the creation of DFSA saw services rendered revenue increase substantially, economic strain on consumers placed pressure on non-value-added drinking milk volumes and pricing, which resulted in service fee income to Clover also coming under pressure. Clover will continue to maximise the return on its distribution and merchandising infrastructure with new products listings and signing of new principals.
Cost of sales
Cost of sales increased by 6,9% or R345,4 million compared on a like-for-like basis. This compares favourably to the 7.9% increase in total revenue. Savings were achieved through a continued and intense focus on efficiencies, recipe reformulations and robust drives to reduce input costs such as ingredients and packaging material. Pressure on primary distribution costs, driven by fuel inflation and transport of product between factories and distribution centres eroded some of the gains.
The cost of raw materials and ingredients increased by 7,6% or R252,9 million, while volumes increased by 8,2%. The cost of basic raw materials (which include milk and or constituents thereof) were 8,3% higher than the previous year, mainly due to the shortage of butterfat which drove up costs. Other ingredients costs increased by 2,3% mainly due to retendering.
Packaging costs increased by 4,2%, primarily because of favourable exchange rates for a large part of the year and retendering.
Manufacturing costs rose by 1,87% year-on-year. Considering the volume increase, this marginal increase was primarily as a result of aggressive cost saving drives and optimisation of production schedules.
Primary distribution costs increased 15,8% or R69,1 million on the back of higher volumes. The majority of this cost is outsourced and driven largely by fuel price and transporters’ wage increases.
Gross profit
Cost of sales increased by 6,9% which compares favourably to the like-for-like increase of 7,9% in revenue. As a result, the like for like gross profit margin increased from 34.9% to 35,5%.
Other operating income
Other operating income of R82,9 million mainly comprise of:
- R25,3 million royalty income earned from DFSA;
- R25,3 million from supplier settlement claims;
- R1,2 million from the sale of PPE;
- R4,4 million gain from unbundling of DFSA;
- R3,6 million gain from fair value adjustments; and
- Sundry income of R12,1 million, largely from the canteen.
Selling and distribution costs
Selling and distribution costs increased marginally by 1,4% or R28,5 million. As explained in the prior year, Clover’s staff structure was optimised and new positions were limited, except for the Masakhane roll-out for which the Group received grant funding income from the DTI of R9.8 million. The benefits of these initiatives led to below inflationary cost increases. Clover further managed to stabilise and contain costs through an efficiency drive, and secondary distribution costs decreased with 3,6% or R44,8 million.
In total, Clover spent 6,3% or R15,4 million more on advertising, marketing, research and development costs compared to the prior year. The higher spend on advertising was strategic to achieve volume growth in the current year as well as to promote new product launches and innovations on existing product lines.
Administrative expenses
Administrative expenses reduced by 4,0% or R11,4 million.
This saving was primarily achieved by reducing head office-related expenses for which overall spend reduced by 12,9% or R30,7 million through:
- subsidising training spend through higher Skills Development Levy (SDL) grants received in this period;
- a reduced level of spend on legal and consulting fees; and
- not filling vacant positions, particularly at executive level.
Restructuring expenses
Approximately R4,1 million was spent on retrenchment costs, which are classified as restructuring expenses. Restructuring expenses is markedly down compared to the previous year and relates primarily to the cost of relocating assets as part of project Sencillo (asset optimisation drive).
Operating profit
Operating profit increased by 94,3% to R611,0 million. Headline operating profit increased by 102,7% to R605,0 million when excluding capital profits. The operating margin increased to 7,4%, a significant improvement over the previous year.
Loss for the year
Loss for the year amounted to R40,7 million compared to a profit for the year amounting to R158,7 million in the comparative period. This result was the outcome of a R296,6 million increase in operating profit, a R439 million impairment of the DFSA revolving credit facility, a R38,9 million decrease in net finance charges, a R98,4 million increase in the income tax expense, and a R2,6 million increase in the share of profits from joint ventures. Normalised profit for the year ended 151,0% or R239,6 million higher at R398,4 million.
Clover’s actual effective tax rate is 141,1% which is primarily as a result of the impairment, however, the normalised effective tax rate was calculated at 25,9%. This is below the 28% SA corporate tax rate. The normalised effective tax rate was lower primarily as a result of:
- Prior year adjustments – (1,7%)
- Botswana lower tax – (0,6%)
- Foreign withholding tax – 0,7%
- Joint Venture Equity accounted – (1,1%)
- Various other adjustments – 0,6%
Return on equity adjusted for exceptional items
The Group experienced a constrained economic and operating environment with variable costs increasing ahead of inflation. However, given the Group’s continued focus on cost containment and the winning back of market shares, the Group’s return on equity adjusted for exceptional items (most notably the RCF impairment) increased from 5,4% to 13,9%.
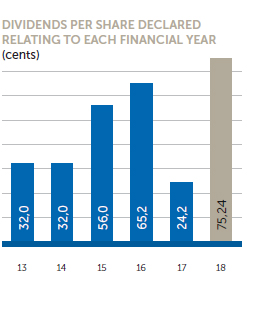
DIVIDENDS
The Company declared and paid an interim dividend of 26,56 cents per share during April 2018. A final dividend of 48,68 cents per share was declared by the board, which will bring the total dividend for the current financial year to 75,24 cents, representing a divided cover of 2,75 times on a normalised basis.
FINANCIAL POSITION
Non-current assets
Clover has invested methodically in acquisitions as well as capacity building and rightsizing of factories and distribution assets to support our high standards on product quality and growth ambitions. The level of investment required to support Clover’s outstanding reputation for quality is balanced by our ambition to grow through acquisitions and internal development of brands and products. Our status as South Africa’s most reputable company was confirmed for the third year in a row by Reptrak, and our brand reputation is underpinned by Clover’s chilled distribution network, which continues to be regarded as one of South Africa’s finest. This invaluable asset also required a significant investment to maintain its hard-earned reputation.
Clover invested R214,7 million on capitalised maintenance, factories, IT upgrades and other tangible assets.
The net decrease in property, plant and equipment and intangible assets amounted to R33,6 million, consisting of R218,1 million additions, less R228 million depreciation and the balance being disposals, transfer to held-for-sale and scrapping of assets.
Major capital projects during the year were:
| R’m | |
| Clayville/Queensburg/Milkyway Milk and Juice consolidation | 16,6 |
|---|---|
| RBC yogurt capacity upgrade | 21,4 |
| Numel capacity expansion | 9,4 |
| PE UHT optimisation project | 9,1 |
| Milnerton capacity expansion | 8,2 |
| Cape Town CDC upgrade | 7,8 |
| PE Pallet optimisation project | 7,2 |
| Lichtenburg AFE Filler | 5,3 |
| 84,9 |
Revolving credit facility granted to DFSA
As part of the operational restructure, the Group made available a revolving credit facility (“RCF”) to DFSA, enabling DFSA to fund its operations and the stock it acquired from the Group when it was established. The facility has been made available to DFSA for an initial period of 20 years and will increase annually with CPI.
The Group will only be able to call this facility if certain default events occur. The maximum amount of the RCF is capped at R550 million for the current year, of which DFSA utilised R439 million. As part of the Group’s mitigation of credit risk, a general notarial bond has been registered over the stock of DFSA.
DFSA made a loss of R128,8 million for the period ended June 2018 and has negative equity of R133,3 million.
Historically the dairy business transferred to DFSA is exposed to seasonal cyclicality and a longer investment horizon is required to establish a trendline.
The below sets out the historical performance of the non-value added dairy business:
- 2012/2013 – Operating loss of R62,7 million;
- 2013/2014 – Operating loss of R126,4 million;
- 2014/2015 – Operating profit R60,5 million;
- 2015/2016 – Operating profit R77,0 million; and
- 2016/2017 – Operating profit R23,8 million.
Based on the above, it is not unexpected that DFSA may make losses, however, as market forces align (i.e. supply and demand), it is expected that profits and losses will balance out.
As the revolving credit facility was granted over a period of 20 years, repayment is not expected over the short-term.
On 11 September 2018, the board received unexpected notification that DFSA’s CEO and subsequently, its chairman, resigned.
Based on this information, Clover’s board deemed it prudent to adopt a conservative approach and provide for the full impairment of the R439 million revolving credit facility it extended to DFSA as at year-end, although the accumulated loss at 30 June 2018 is only R133.2 million.
The impairment of the revolving credit facility will be assessed on a continuous basis, taking into consideration the general notarial bond that Clover holds over the DFSA inventory and debtors’ balances that is being managed by Clover as part of Clover’s services rendered agreement, as well as the DFSA board approved plans to manage the business through the cycle.
More detail is available in note 13 to the annual financial statements.
CURRENT ASSETS
Inventory
Inventory levels decreased by 9,9% or R95,6 million
The establishment of DFSA led to a reduction of R244 million in UHT milk inventory as UHT is no longer carried by Clover. Inventory carried on other products increased because of normal business growth and new products added to Clover’s portfolio.
Trade and other receivables
Trade and other receivables increased by 10,3% or R137,7 million.
The increase is as a result of manufacturing, distribution and sales and merchandising services rendered to DFSA as well as volume growth achieved in the current period.
Trade receivable days outstanding and bad debts remained at minimal levels when compared to the combined sales of Clover and those principals for which we provide credit management. (Analysts should note that trade receivable days outstanding cannot be deduced from the financial statements as the full receivables of certain distribution principals are included in trade receivables while the revenue of such principals is not included in the Statement of Comprehensive Income. Only fees earned from providing the services involved are included in revenue).
Equity
Share premium
The share premium account remained unchanged from the prior financial year.
Other capital reserves
During the year the Group remeasured the put option liability. The liability decreased from R57,1 million to R23,2 million and in terms of the Group’s accounting policy, any adjustment to the liability will be recorded in equity. Accordingly, the movement of R33,9 million movement was recorded in equity and is disclosed as part of other capital reserves. The remainder of the movement (R6,8 million) relates to the exercise of share appreciation rights.
Non-current liabilities
Higher normalised operating profit, reduced investment in working capital, and contained capital expenditure were the primary contributors to a R131,2 million net decrease in interest-bearing debt (both current and non-current).
Apart from interest-bearing debt, non-current liabilities were similar to the previous year, with the exception of the deferred tax liability that increased by R39,2 million. This increase is primarily driven by accelerated depreciation allowances claimed for tax purposes and the utilisation of assessed losses in some of the Group’s subsidiaries.
Current liabilities
Trade and other payables increased by R401,5 million or 31,5%. This increase is driven by the addition of DFSA as a principal, where Clover collects sales revenue on behalf of
DFSA and pays the same over to DFSA after 30 days from statement. Clover also negotiated more favourable payment terms with certain suppliers.
The increase in other current financial liabilities of R7,5 million is mainly as a result of the shares forward purchases maturing in the next 12 months.
Employee-related obligations increased by 107,5% or R10,5 million which is largely offset by the R7.2 million reduction in employee-related obligations under non-current liabilities. Overall the obligation increased by 3,6% which is below average salary increases and mainly due to DFSA employees no longer forming part of the Group.
GEARING
Group gearing decreased from 51,4% to 47,8% at 30 June 2018. Net working capital (including the RCF advanced to DFSA) increased year-on-year by R92,9 million or 9,2%. Clover’s gearing is well within its ability to service interest and repayments.
CASH FLOW
Clover’s net current asset ratio decreased from 1,4 to 1,3. Excluding inventory, the position remained unchanged at 1,0.
Cash generated from operations, before working capital changes, totalled R769,5 million compared to R439,2 million reported in the prior year. Better cash generation was primarily due to the higher profit recorded (excludes the DFSA revolving credit facility impairment which is a non-cash item) as explained above and a reduction in finance changes. In the current year, working capital generated R348,2 million of cash compared to R162,2 million in the prior year. Clover held R95,5 million less inventory in comparison to the previous corresponding period. Trade and other receivable increased by R134,7 million compared to last year given the overall growth in revenue and services rendered to DFSA.
Investment activities consumed R578,7 million in cash compared to R277,7 million in the previous year, following the RCF advanced to DFSA. Clover also spent R104,4 million less capital on tangible and intangible assets.
Under financing activities, R163,0 million was paid for finance costs and dividends, compared to R260,9 million in the previous year. Clover reported a net reduction in interest-bearing borrowings of R163,3 million at the end of the year.
The Group’s cash position for the year increased by R215,8 million.
SEGMENTAL PERFORMANCE
Segmental information is only disclosed to Margin on Materials (MOM) level as Clover’s assets and operations are largely integrated between segments, which makes the allocation of overhead costs to the different segments impractical. Overheads are managed at Group level.
MOM refers to revenue, less raw material, ingredients and packaging costs. Clover’s entry into the yoghurt and custard markets under our own brands necessitated the establishment of a dedicated fermented products and desserts segment to manage our yoghurt, custard and maas. A segment for Olives and Soy products was also added.
Value-added dairy fluids
The dairy fluids segment consists of value-added dairy fluids sold in SA, and dairy fluids sales in Namibia, Botswana, Swaziland as well as through Clover Milkyway.
Revenue for this segment was down by 73,5%, primarily due to DFSA sales no longer forming part of the Group. However, on a like-for-like basis, revenue in this segment increased by 12,5% mainly due to volume growth achieved by Numel.
Average selling prices remained largely unchanged except for cream that increased 11,8% due to a shortage of butterfat. As a result, cream volumes decreased by 3,8% (partially due to the inability to meet market demand). MOM from value added dairy fluids was 39,6%.
Concentrated products
The concentrated dairy products segment consists of cheese, butter, condensed milk and retail milk powders.
Revenue in concentrated products increased by 13,7% and was supported by with higher selling prices of 8,6 %, mainly on butter due to the butterfat shortage, and overall increase in volumes of 5,1%. MOM increased from 30,0% to 36,5%.
Due to an increase in global demand for butter, and limited availability of cream, butter and spreads volumes were down 3,1%.
Natural pre-packed cheese volumes increased by 3,1% whilst average selling prices remained flat. Clover entered the sliced processed cheese category in the prior year and aggressively pursued market share in the current year. Volumes increased 24,4% compared to the prior year.
Feta volumes were up 6,4% and condensed milk volumes flat.
From 1 July 2017, the bulk of milk collection cost is included in the price of milk purchased from DFSA. The remaining portion relates to milk collection costs associated Clover Milkyway.
As milk collection cost now forms part of material cost, the comparison for all remaining segments is done inclusive of milk collection cost. The price and mix variance for the segment on packaging, material and milk collection increased by 3,3% on average.
Ingredients
Although Clover does not at present participate actively in the international dairy ingredients market, we balance seasonal milk and cheese production by annually selling excess skimmed milk and whey powder into the local ingredients market.
Revenue for this segment was down 18,5% because of volume losses. Notwithstanding MOM increased from 32,9% to 36,8% due to lower input costs.
Average selling prices decreased by 8,1% and volumes decreased by 10,4% for the period.
Non-alcoholic beverages
Non-alcoholic beverages consist of pure juices, dairy fruit mix (Tropika), nectar, ice-tea, water, flavoured milk and long-life juices.
Revenue for this segment increased by 1,7% where price increases offset volume losses.
Average selling prices were flat for the current year and the segment’s volumes grew by 1.7% for the period. The category’s performance is largely driven by dairy fruit mix, juices and waters. Volumes for pure juice was up 3,4%, dairy fruit mix up 1,4%, ice-tea down 15,5% and water down 4%.
The price and mix variance for raw materials and packaging includes the effects of sugar tax which became effective 1 April 2018, however, this was mitigated by decreased cost in sugar and pulp in the form of supplier rebates. The cost of material, packaging and milk collection decreased 5,9% on average. MOM from non-alcoholic beverages was 56,6%.
Fermented products and desserts
This product segment consists of yoghurt, maas and custard.
Clover’s reinvestment in selling prices led to volume increases and revenue for this segment increased by 25,7%. The cost of materials, ingredient, packaging and milk collection on average increased by 8.9% notwithstanding volume increases of 32,5%. This was largely as a result of robust packaging retender initiatives and significant savings from recipe reformulation. As a result, MOM was up 8,0% to 35,7%.
Maas volumes increased 54,9%, yoghurt 23,2%, and custard 6,5%.
Olive oil and soya
The Group recently entered the olive oil market and has been participating in the dairy alternative market (soya) for almost two years now.
Revenue from this segment increased 93,0% mainly due to the prior year only containing three months of trading in the olive oil market. Volumes and average selling prices from soya decreased by 1,6% and 5,8% respectively.
The olive oil business benefited from good exchange rates during the year, however, towards the latter part margins came under pressure as the exchange rates started to increase. A meaningful analysis of volumes and revenue will be available in the next financial year, once a comparable benchmark has been established.
CONCLUSION
Encouraging signs of improving business and economic prospects at the beginning of 2018 has dissipated at the time of writing.
The consumer landscape remains challenging with a general inability to raise discretionary spending levels as a result of above-inflationary living cost increases and persistent high levels of unemployment.
Looking through the cycle, management remains confident of the Group’s continued performance as the full impact of actions taken to date are expected to benefit the business over time.
Management will continue to drive volume and market share growth whilst expanding Clover’s value-added product portfolio. Further cost efficiencies and synergistic opportunities to leverage the Group’s asset base and infrastructure will be explored.

Frantz Scheepers
Chief Financial Officer
26 September 2018
FINANCIAL HIGHLIGHTS