Shareholder analysis
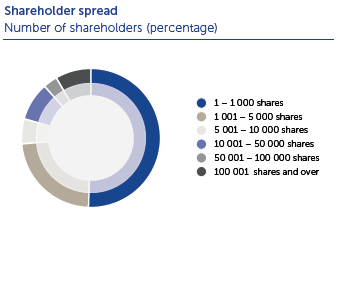
| Shareholder spread | No of Shareholdings |
% | No of Shares | % |
| 1 - 1,000 shares | 1 403 | 50.72 | 318 021 | 0.17 |
| 1,001 - 5,000 shares | 634 | 22.92 | 1 507 557 | 0.79 |
| 5,001 - 10,000 shares | 161 | 5.82 | 1 169 061 | 0.61 |
| 10,001 - 50,000 shares | 251 | 9.07 | 5 778 917 | 3.03 |
| 50,001 - 100,000 shares | 93 | 3.36 | 6 912 049 | 3.62 |
| 100,001 shares and over | 224 | 8.10 | 175 149 759 | 91.78 |
| Totals | 2766 | 100 | 190 835 364 | 100 |
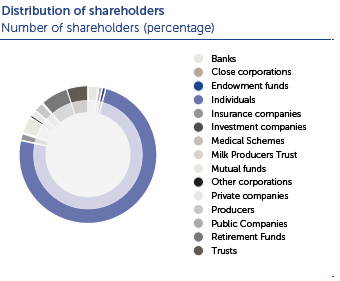
| Distribution of shareholders | No of Shareholdings |
% | No of Shares | % |
| Banks/Brokers | 71 | 2.57 | 23 700 000 | 11.05 |
| Close Corporations | 22 | 0.80 | 46 000 | 0.02 |
| Endowment Funds | 23 | 0.83 | 172 013 | 0.08 |
| Individuals | 2 058 | 74.40 | 42 488 608 | 19.80 |
| Insurance Companies | 39 | 1.41 | 3 007 122 | 1.40 |
| Investment Companies | 4 | 0.14 | 4 861 396 | 2.27 |
| Medical Schemes | 4 | 0.14 | 494 444 | 0.23 |
| Milk Producers Trust | 2 | 0.07 | 23 700 000 | 11.05 |
| Mutual Funds | 113 | 4.09 | 45 564 402 | 21.24 |
| Other Corporations | 14 | 0.51 | 443 654 | 0.21 |
| Private Companies | 34 | 1.23 | 10 166 774 | 4.74 |
| Producers | 66 | 2.39 | 5 700 474 | 2.66 |
| Public Companies | 1 | 0.04 | 466 236 | 0.22 |
| Retirement Funds | 182 | 6.58 | 37 111 760 | 17.30 |
| Trusts | 133 | 4.81 | 16 469 337 | 7.68 |
| Totals | 2766 | 100 | 214 392 220 | 99.93 |
| Public/non - public shareholders | No of Shareholdings |
% | No of Shares | % |
| Non - Public Shareholders | 17 | 0.61 | 35416086 | 18.56 |
| Directors of the company | 13 | 0.47 | 10521866 | 5.51 |
| Executives Management of the company | 2 | 0.07 | 1194220 | 0.63 |
| Strategic Holdings (more than 10%) | 2 | 0.07 | 23700000 | 12.42 |
| Public Shareholders | 2749 | 99.39 | 178976134 | 81.37 |
| Totals | 2766 | 100 | 214 392 220 | 99.93 |
| Beneficial shareholders holding 3% or more | No of Shares | % |
| Clover Milk Producers Trust | 23 700 000 | 12.42 |
| Allan Gray | 15 016 816 | 7.87 |
| Government Employees Pension Fund | 11 530 526 | 6.04 |
| Letko Brosseau | 11 058 505 | 5.79 |
| Vorster, JH | 8 588 925 | 4.50 |
| HSBC | 7 797 605 | 4.09 |
| Eskom Pension & Provident Fund | 5 563 532 | 2.92 |
| Totals | 83 255 909 | 43.63 |
| Company: Register date: Issued Share Capital: |
Clover Industries Limited 29 June 2018 190 835 364 |
ANNEXURE I TO THE RESULTS ANNOUNCEMENT FOR THE
YEAR ENDED 30 JUNE 2018
PRO FORMA REGARDING THE EFFECT OF THE OPERATIONAL RESTRUCTURING OF DFSA ON THE
CONSOLIDATED RESULTS OF CLOVER INDUSTRIES LIMITED (“Clover”)
Introduction
On the 1st of July 2017 Clover concluded a corporate action that would have an impact on the 2018 financial year.
As communicated on the Stock Exchange News Service on 6 July 2017 and earlier, Clover has formed a wholly owned subsidiary (called Dairy Farmers of South Africa (Pty) Ltd (‘DFSA’)). Clover transferred the non-value added dairy business and sold the related finished goods, packaging material and ingredients inventory, to DFSA with effect from 1 April 2017. In exchange for the transfer of the non-value added dairy business as aforementioned, DFSA allotted and issued to Clover A- shares (which constituted the entire issued share capital of DFSA at the time) for a nominal amount, and a loan account for the inventory.
With effect from 1 July 2017, DFSA issued and allotted B-shares in to the milk producers for a nominal amount and accordingly, the milk producers now hold all the B shares which constitute 74% of the voting rights of DFSA. Clover holds all the A-shares which constitute 26% of the voting rights of DFSA.
With effect from 1 July 2017 Clover relinquished its control of DFSA, assessed in terms of IFRS 10, and will for accounting purposes treat it as an investment in an associate going forward.
DFSA houses the non-value added drinking milk business and is responsible for the procurement of raw milk as well as the selling, marketing and distribution of the non-value-added drinking milk referred to above.
DFSA is currently Clover’s largest principal, where all its related requirements such as distribution, production, administration (invoicing, debt collection, marketing), IT services, payroll administration, central services, sales and merchandising are outsourced to Clover for an initial period of 20 years. In exchange for these services, Clover will earn service income.
This Annexure to the results announcement includes the 30 June 2017 audited results which have been adjusted to reflect the loss of control of DFSA (“Pro Forma Adjustments”) as if the loss of control of DFSA had occurred (a) on 1 July 2016 for purposes of the Pro Forma Adjustments made to the Pro Forma consolidated statement of comprehensive income and (b) as at 30 June 2017 for purposes of the Pro Forma Adjustments made to the Pro Forma consolidated statement of financial position.
It is important to note that in the 2017 Pro Forma financial information of the Group, released on SENS on 12 September 2017 as an annexure to the financial results for the year ended 30 June 2017 (“2017 Pro Forma Financial Information”), it was anticipated that Clover would procure packaging material from third party suppliers and on-sell the packaging material to DFSA at no margin. The 2017 Pro Forma financial information was compiled as if Clover acted as the principal. Post the implementation of the unbundling on 1 July 2017, the legal agreement was clarified to infer that Clover is acting as an agent for packaging material procured on behalf of DFSA. In terms of this clarification the Revenue and Cost of Sales pertaining to the procurement of the packaging material does not form part of the 2018 audited results of the Group. Accordingly, the directors are of the view that the Pro Forma adjustment (refer note 4) as disclosed in the 2017 Pro Forma Financial Information needs to be amended by excluding the sale of packaging material procured and sold to DFSA in order to do a like for like comparison.
The Pro Forma financial information, as presented in the 2018 Group Results, have been prepared for illustrative purposes only, to provide information about how the Pro Forma Adjustments might have affected the financial information presented by Clover had the unbundling of DFSA occurred on 1 July 2016 for statement of comprehensive income purposes and as at 30 June 2017 for statement of financial position purposes. Because of its Pro Forma nature, the Pro Forma financial information may not fairly present Clover’s financial position, changes in equity, results of operation or cash flows. It does not purport to be indicative of what the financial results would have been, had the loss of control of DFSA been implemented on a different date.
The Clover directors are responsible for the preparation of the Pro Forma financial information. The Pro Forma financial information has been prepared using accounting policies that are consistent with IFRS and with the basis on which the historical financial information has been prepared in terms of the accounting policies of Clover. The Pro Forma financial information has been prepared in accordance with the JSE Listings Requirements and the revised Guide on Pro Forma Financial Information issued by the South African Institute of Chartered Accountants.
These Pro Forma financial effects have been prepared to assist Clover’s shareholders in assessing the impact of the loss of control of DFSA on the Clover consolidated statement of comprehensive income and statement of financial position.
This Pro Forma financial information has been reported on by the independent external auditors, Ernst & Young Inc., in terms of International Standards on Assurance Engagements (ISAE) 3420, Assurance Engagements to Report on the Compilation of Pro Forma Financial Information Included in a Prospectus. Their unmodified limited assurance report dated 11 September 2017 is available for inspection at the Company's registered office.
PRO FORMA CONSOLIDATED STATEMENT OF COMPREHENSIVE INCOME
| 30 June 2017 Audited (1) R’000 |
Exclusion of the revenue and cost of sales of the DFSA business (2) Pro Forma adjustment R’000 |
Income from services rendered to DFSA (3) Pro Forma adjustment R’000 |
Interest charged on working capital facility (4) Pro Forma adjustment R’000 |
After Pro Forma Adjustments R’000 |
30 June 2018 Normalised (5) R’000 |
|
| Sales of products | 9 401 842 | (3 549 806) | 5 852 036 | 6 435 663 | ||
|---|---|---|---|---|---|---|
| Rendering of services | 641 499 | 1 192 922 | 1 834 421 | 1 873 581 | ||
| Sale of raw milk | 11 907 | 11 907 | 335 | |||
| Rental income | 3 351 | 3 351 | 2 898 | |||
| Revenue | 10 058 599 | (3 549 806) | 1 192 922 | 7 701 715 | 8 312 477 | |
| Cost of sales | (7 333 041) | 2 321 032 | (5 012 009) | (5 357 424) | ||
| Gross profit | 2 725 558 | (1 228 774) | 1 192 922 | 2 689 706 | 2 955 053 | |
| Other operating income | 60 040 | 60 040 | (82 913) | |||
| Selling and distribution costs | (2 089 364) | (2 089 364) | (2 117 936) | |||
| Administrative expenses | (284 721) | (284 721) | (273 310) | |||
| Restructuring expenses | (48 098) | (48 098) | (4 123) | |||
| Other operating expenses | (48 936) | (48 936) | (31 548) | |||
| Operating profit | 314 479 | (1 228 774) | 1 192 922 | 278 627 | 611,049 | |
| Finance income | 12 647 | 35 852 | 48 499 | 47 618 | ||
| Finance costs | (145 765) | (145 765) | (141 880) | |||
| Share of profit in a joint venture | 18 486 | 18 486 | 21 104 | |||
| Profit before tax | 199 847 | (1 228 774) | 1 192 922 | 35 852 | 199 847 | 537 891 |
| Taxation | (41 105) | 344 057 | (334 018) | (10 039) | (41 105) | (139 509) |
| Profit for the year | 158 742 | (884 717) | 858 904 | 25 813 | 158 742 | 398 382 |
PRO FORMA CONSOLIDATED STATEMENT OF FINANCIAL POSITION
| 30 June 2017 Audited (1) R’000 |
Sale of inventory (6) Pro Forma adjustment R’000 |
After Pro Forma Adjustments R’000 |
|
| Assets | |||
| Non-Current assets | |||
| Property, plant and equipment | 2 427 444 | 2 4727 444 | |
| Investment properties | 9 | 9 | |
| Intangibles assets | 650 663 | 650 663 | |
| Investment in joint ventures | 38 946 | 38 946 | |
| Other non-current financial assets | 3 165 | 3 165 | |
| Deferred tax assets | 45 496 | 445 496 | |
| 3 165 723 | 3 165 723 | ||
| Current assets | |||
| Inventories | 964 630 | (244 076) | 720 554 |
| Trade and other receivables | 1 341 311 | 244 076 | 1 585 387 |
| Prepayments | 19 844 | 19 844 | |
| Income tax receivable | 7 165 | 7 165 | |
| Cash and short term deposits | 544 863 | 544 863 | |
| 2 877 813 | 2 877 813 | ||
| 4 607 | 4 607 | ||
| Total assets | 6 048 143 | 6 048 143 |
| 30 June 2017 Audited (1) R’000 |
Sale of inventory (6) Pro Forma adjustment R’000 |
After Pro Forma Adjustments R’000 |
|
| Equity and liabilities | |||
| Equity | |||
| Issued share capital | 9 542 | 9 543 | |
| Share premium | 892 692 | 892 692 | |
| Other capital reserves | 78 642 | 78 642 | |
| Foreign currency translation reserve | 9 637 | 9 637 | |
| Retained earnings | 1 904 349 | 1 904 349 | |
| Equity attributable to holders of the parent | 2 894 862 | 2 894 862 | |
| Non-controlling interests | (15 179) | (15 179 | |
| Total equity | 2 879 683 | 2 879 683 | |
| Liabilities | |||
| Non-current liabilities | |||
| Interest bearing loans and borrowings | 767 621 | 767 621 | |
| Non-controlling put liability | 57 088 | 57 088 | |
| Employee-related obligations | 82 595 | 82 595 | |
| Deferred tax liability | 221 065 | 221 065 | |
| Trade and other payables | 25 492 | 25 492 | |
| Other non-current financial liabilities | 9 683 | 9 683 | |
| 1 163 544 | 1 163 544 | ||
| Current liabilities | |||
| Trade and other payables | 1 274 700 | 1 274 700 | |
| Interest-bearing loans and borrowings | 714 304 | 714 304 | |
| Other current financial liabilities | 6 141 | 6 141 | |
| Employee-related obligations | 9 771 | 9 771 | |
| 2 004 916 | 2 004 916 | ||
| Total liabilities | 3 168 460 | 3 168 460 | |
| Total equity and liabilities | 6 048 143 | 6 048 143 |
Notes:
- As per the consolidated statement of comprehensive income and the consolidated statement of financial position for the year ended 30 June 2017 with reference to the Audited Annual Financial Statements.
- The sale of products relating to the non-value added drinking milk, namely Fresh, UHT and UP milk that will be excluded from Clover and be part of DFSA in future. The Pro Forma Adjustment was determined with reference to actual volumes sold and realised. The tax effect was determined using the corporate tax rate of 28%.
- Clover provided all the production, distribution, sales and merchandising, marketing and certain administrative service to DFSA at a contracted fee. The Pro Forma adjustment was determined with reference to actual volumes produced. The contracted fee was calculated based on the actual costs for the period 1 July 2016 to 31 December 2016. The tax effect was determined using the corporate tax rate of 28%.
- Clover provided the working capital funding to DFSA in the form of an interest-bearing facility on which Clover earned interest at a rate equal to the average rate Clover pays to its interest-bearing debt funders. The tax effect was determined using the corporate tax rate of 28%.
- As per the normalised Pro Forma consolidated statement of comprehensive income for the year ended 30 June 2018 with reference to the Annexure II.
- All the finished goods, packaging material and ingredients inventory related to Fresh, UHT and UP milk were sold to DFSA on loan account on 1 April 2017. It was assumed that the inventory was sold in the same manner on 30 June 2017 to give effect to the Pro Forma Adjustment.
- The loss of control of DFSA was structured in such a way that the non-value-added drinking milk business broke even and therefore there was no equity accounted earnings or Investment in Associate in terms of IAS28.
- IFRS 10 Consolidated Financial Statements paragraph 25 requires the calculation of a gain /(loss) on the deemed sale of the investment in DFSA when control is lost. On 1 July 2016 this gain / (loss) on the deemed sale would however equal the nominal amount received as consideration for the B shares issued by DFSA. It was assumed that the inventory, the only asset of DFSA on 1 July 2016, was sold in the same manner on this date as it was on 1 April 2017. Therefore, the fair value of any retained interest is zero.
ANNEXURE II TO THE RESULTS ANNOUNCEMENT FOR THE YEAR ENDED 30 JUNE 2018
PRO FORMA REGARDING THE EFFECT OF THE IMPAIRMENT ON THE RCF TO DFSA ON THE CONSOLIDATED RESULTS OF CLOVER INDUSTRIES LIMITED (“Clover”)
Background
The board of Clover Industries Limited (“Clover” or “the Group”) received unforeseen notice of the resignation of the DFSA CEO on 11 September 2018. His decision to resign is understood to be as result of the enormous conflict between losing milk producers or losing market share during what has been a very challenging time for the dairy industry generally.
The Chairman of DFSA also took the decision to resign and to give the opportunity to the producer shareholders to appoint their own independent chairman and CEO to take DFSA forward. The DFSA board will begin the process to identify replacements and the current CEO will stay on until 30 April 2019 to assist with identifying a suitable replacement and to ensure a seamless handover.
Whilst the Clover board had received no indications of the resignations at the time it published its trading statement on 07 August 2018, following the resignation of the DFSA Chairman and CEO, it believed it prudent to adopt a conservative approach and provide for the full impairment of the R439 million revolving credit facility it extended to DFSA as at year-end.
This Annexure (“Annexure II”) to the results announcement includes the 30 June 2018 audited results which have been adjusted to reflect the reversal of the impairment (a) on 30 June 2018 for purposes of the Pro Forma adjustments made to the Pro Forma consolidated statement of comprehensive income and (b) as at 30 June 2018 for purposes of the Pro Forma adjustments made to the Pro Forma consolidated statement of financial position.
The Pro Forma financial information, as presented in the 2018 Group results, have been prepared for illustrative purposes only, to provide information on how the normalised earnings and headline earnings have been calculated had no impairment taken place.
Because of its nature, the Pro Forma financial information may not be a fair reflection of the Group’s results of operations, financial position, changes in equity or cash flows. No other adjustments have been made to the Pro Forma financial information.
The Clover directors are responsible for the preparation of the Pro Forma financial information. The Pro Forma financial information has been prepared using accounting policies that are consistent with IFRS and with the basis on which the historical financial information has been prepared in terms of the accounting policies of Clover. The Pro Forma financial information has been prepared in accordance with the JSE Listings Requirements and the revised Guide on Pro Forma Financial Information issued by the South African Institute of Chartered Accountants.
This Pro Forma financial information was reported on by the independent external auditors, Ernst & Young Inc., in terms of International Standards on Assurance Engagements (ISAE) 3420, Assurance Engagements to Report on the Compilation of Pro Forma Financial Information Included in a Prospectus. Their unmodified limited assurance report is available for inspection at the Company’s registered office.
These latest developments should not deter from the exceptional performance delivered by Clover as highlighted in the normalised results discussed earlier in this report.
PRO FORMA CONSOLIDATED STATEMENT OF COMPREHENSIVE INCOME
| 30 June 2018 Audited (1) R’000 |
Reversal of impairment Pro Forma adjustment (2) R’000 |
After Pro Forma Normalised R’000 |
30 June 2017 Adjusted (3) R’000 |
|
| Sales of products | 6 435 663 | 6 435 663 | 5 852 036 | |
|---|---|---|---|---|
| Rendering of services | 1 873 581 | 1 873 581 | 1 834 421 | |
| Sale of raw milk | 335 | 335 | 11 907 | |
| Rental income | 2 898 | 2 898 | 3 351 | |
| Revenue | 8 312 477 | 8 312 477 | 7 701 715 | |
| Cost of sales | (5 357 424) | (5 357 424) | (5 012 009) | |
| Gross profit | 2 955 053 | 2 955 053 | 2 689 706 | |
| Other operating income | 82 913 | 82 913 | 60 040 | |
| Selling and distribution costs | (2 117 936) | (2 117 936) | (2 089 364) | |
| Administrative expenses | (273 310) | (273 310) | (284 721) | |
| Restructuring expenses | (4 123) | (4 123) | (48 098) | |
| Other operating expenses | (31 548) | (31 548) | (48 936) | |
| Operating profit | 611 049 | 611 049 | 278 627 | |
| Impairment of revolving credit facility to DFSA | (439 042) | 439 042 | – | – |
| Finance income | 47 618 | 47 618 | 48 499 | |
| Finance costs | (141 880) | (141 880) | (145 765) | |
| Share of profit in a joint venture | 21 104 | 21 104 | 18 486 | |
| Profit before tax | 98 849 | 439 042 | 537 891 | 199 847 |
| Taxation | (139 509) | (139 509) | (41 105) | |
| (Loss)/Profit for the year | (40 660) | 439 042 | 398 382 | 158 742 |
| Profit for the year attributable to equity holders of the parent company | (38 021) | 439 042 | 401 021 | 158 258 |
| Headline earnings attributable to shareholders of the parent company | (44 180) | 439 042 | 394 854 | 121 617 |
| Earnings per share attributable to ordinary equity holders of the parent | ||||
| (Loss)/Earnings per share (cents) | (19,9) | 230,0 | 210,1 | 83,1 |
| Diluted (loss)/earnings per share (cents) | (19,7) | 227,8 | 208,1 | 82,3 |
| Headline (loss)/earnings per share (cents) | (23,1) | 230,0 | 206,9 | 63,9 |
| Diluted headline (loss)/earnings per share (cents) | (22,9) | 227,8 | 204,9 | 63,2 |
PRO FORMA CONSOLIDATED STATEMENT OF FINANCIAL POSITION
| 30 June 2018 Audited (1) R’000 |
Reversal of impairment Pro Forma 4 adjustment R’000 |
After Pro Forma Normalised R’000 |
30 June 2017 Adjusted (3) R’000 |
|
| ASSETS | ||||
| Non-current assets | ||||
| Property, plant and equipment | 2 417 791 | 2 417 791 | 2 427 444 | |
| Investment properties | 9 | 9 | 9 | |
| Intangible assets | 626 671 | 626 671 | 650 663 | |
| Investment in joint venture | 46 035 | 46 035 | 38 946 | |
| Other non-current financial assets | 5 781 | 439 042 | 444 823 | 3 165 |
| Deferred tax assets | 30 203 | 30 203 | 45 496 | |
| 3 126 490 | 439 042 | 3 565 532 | 3 165 723 | |
| Current assets | – | |||
| Inventories | 869 091 | 869 091 | 964 630 | |
| Trade and other receivables | 1 479 090 | 1 479 090 | 1 341 311 | |
| Prepayments | 16 829 | 16 829 | 19 844 | |
| Income tax receivable | 3 702 | 3 702 | 7 165 | |
| Cash and short-term deposits | 760 693 | 760 693 | 544 863 | |
| 3 129 405 | 3 129 405 | 2 877 813 | ||
| Assets classified as held-for-sale | 2 719 | 2 719 | 4 607 | |
| Total assets | 6 258 614 | 439 042 | 6 697 656 | 6 048 143 |
| 30 June 2018 Audited (1) R’000 |
Reversal of impairment Pro Forma 4 adjustment R’000 |
After Pro Forma Normalised R’000 |
30 June 2017 Adjusted (3) R’000 |
|
| EQUITY AND LIABILITIES | ||||
| Equity | ||||
| Issued share capital | 9 542 | 9 542 | 9 542 | |
| Share premium | 892 692 | 892 692 | 892 692 | |
| Other capital reserves | 105 689 | 105 689 | 78 642 | |
| Foreign currency translation reserve | 17 160 | 17 160 | 9 637 | |
| Retained earnings | 1 817 322 | 439 042 | 2 256 364 | 1 904 349 |
| Equity attributable to equity holders of the parent | 2 842 405 | 439 042 | 3 281 447 | 2 894 862 |
| Non-controlling interests | (17 818) | (17 818) | (15 179) | |
| Total equity | 2 824 587 | 439 042 | 3 263 629 | 2 879 683 |
| Liabilities | ||||
| Non-current liabilities | ||||
| Interest-bearing loans and borrowings | 665 059 | 665 059 | 767 621 | |
| Non-controlling interest put liability | 23 226 | 23 226 | 57 088 | |
| Employee-related obligations | 75 424 | 75 424 | 82 595 | |
| Deferred tax liability | 260 309 | 260 309 | 221 065 | |
| Trade and other payables | 11 448 | 11 448 | 25 492 | |
| Other non-current financial liabilities | 2 776 | 2 776 | 9 683 | |
| 1 038 242 | 1 038 242 | 1 163 544 | ||
| Current liabilities | – | |||
| Trade and other payables | 1 676 176 | 1 676 176 | 1 274 700 | |
| Interest-bearing loans and borrowings | 685 691 | 685 691 | 714 304 | |
| Other current financial liabilities | 13 639 | 13 639 | 6 141 | |
| Employee-related obligations | 20 279 | 20 279 | 9 771 | |
| 2 395 785 | 2 395 785 | 2 004 916 | ||
| Total liabilities | 3 434 027 | 3 434 027 | 3 168 460 | |
| Total equity and liabilities | 6 258 614 | 439 042 | 6 697 656 | 6 048 143 |
| Notes | |
| 1 | As per the consolidated statement of comprehensive income and the consolidated statement of financial position for the year ended 30 June 2018 with reference to the audited annual financial statements. |
| 2 | The Pro Forma was determined with reference to the impairment of the entire revolving credit facility advanced to DFSA as at 30 June 2018. There is no tax effect due to this adjustment. The adjustment is not excluded for purposes of determining headline earnings. |
| 3 | As per the Pro Forma consolidated statement of comprehensive income and the Pro Forma consolidated statement of financial position for the year ended 30 June 2017 with reference to Annexure I. |
| 4 | The Pro Forma was determined with reference to the impairment of the entire revolving credit facility advanced to DFSA as at 30 June 2018. The facility is designated as a financial asset at amortised cost. The carrying value of the revolving credit facility approximates the fair value due to the rolling nature of the facility and interest being charged. |